Level 5 · Quantum information · Prerequisite lessons: L5-01 (States and the Born rule), L5-02 (Gates and circuit order), L5-05 (Density operators and reduced states).
What you’ll learn:
How two angles describe every pure qubit state, and how that state becomes a point on a sphere.
How the Born rule turns the Bloch vector into measurement probabilities.
Why a finite number of shots only estimates a probability, and how the error shrinks with more shots.
Why mixed states live inside the sphere, and how purity measures the distance from the surface.
Everything here is a classical simulation of textbook equations Basics of quantum information, n.d.Preskill, n.d.. No quantum hardware is used.

import math
import numpy as np
import matplotlib.pyplot as plt
import plotly.graph_objects as go
from qcai import science as s
from qcai.viz import show

np.set_printoptions(precision=4, suppress=True)
1 · From two angles to a point
You can always write a pure qubit state (up to an unobservable global phase) as
Its Bloch vector is .
# Run: compare three routes to the same numbers.
#  (1) the closed-form engine function s.qubit
#  (2) the density matrix |psi><psi| and Tr(rho P)
#  (3) the Born rule |<0|psi>|^2
g = np.random.default_rng(0)
for theta, phi in [(0.0, 0.0), (math.pi / 2, 0.0), (math.pi / 2, 1.1), *g.uniform(0, math.pi, size=(20, 2))]:
    q = s.qubit(theta, phi)
    psi = s.ket(theta, phi)
    rho = s.dm(psi)
    r = s.bloch(rho)
    assert np.allclose(r, [q["x"], q["y"], q["z"]], atol=1e-12)
    assert abs(abs(psi[0]) ** 2 - q["p0"]) < 1e-12
    assert abs(q["p0"] - math.cos(theta / 2) ** 2) < 1e-12
    assert abs(np.linalg.norm(r) - 1) < 1e-12          # pure states sit ON the sphere

q = s.qubit(math.pi / 2, 0.7)
print(f"theta = pi/2: p0 = {q['p0']:.4f}, Bloch vector = ({q['x']:.3f}, {q['y']:.3f}, {q['z']:.3f})")
assert abs(q["p0"] - 0.5) < 1e-12 and abs(q["z"]) < 1e-12
theta = pi/2: p0 = 0.5000, Bloch vector = (0.765, 0.644, 0.000)
Explain. At the state lies on the equator (), so whatever is. A measurement cannot see the phase . It shows up only in or measurements. The three routes agree to machine precision, and every pure state has .
2 · An interactive Bloch sphere
Drag the θ slider to tilt the state away from (north pole) towards (south pole). Drag the φ slider to rotate it around the axis. Rotate the sphere with the mouse. The label at the tip shows .
The figure is precomputed, so both controls work without a running Python kernel. The θ slider rewrites the arrow for every φ value, and the φ slider chooses which arrow is visible.
thetas = np.linspace(0, math.pi, 13)                      # 0, 15, ..., 180 degrees
phis = np.linspace(0, 2 * math.pi, 12, endpoint=False)    # 0, 30, ..., 330 degrees

def arrow(theta, phi):
    q = s.qubit(theta, phi)
    return [0, q["x"]], [0, q["y"]], [0, q["z"]], ["", f"p0 = {q['p0']:.3f}"]

u, v = np.mgrid[0:2 * np.pi:40j, 0:np.pi:20j]
base = [
    go.Surface(x=np.cos(u) * np.sin(v), y=np.sin(u) * np.sin(v), z=np.cos(v), opacity=0.15,
               showscale=False, colorscale=[[0, "#4c78a8"], [1, "#4c78a8"]], hoverinfo="skip"),
    go.Scatter3d(x=np.cos(u[:, 0]), y=np.sin(u[:, 0]), z=0 * u[:, 0], mode="lines",
                 line=dict(color="gray", width=2), hoverinfo="skip", name="equator"),
    go.Scatter3d(x=[-1.2, 1.2, None, 0, 0, None, 0, 0], y=[0, 0, None, -1.2, 1.2, None, 0, 0],
                 z=[0, 0, None, 0, 0, None, -1.2, 1.2], mode="lines", line=dict(color="black", width=2),
                 hoverinfo="skip", name="axes"),
    go.Scatter3d(x=[0, 0, 1.3, 0], y=[0, 0, 0, 1.3], z=[1.3, -1.3, 0, 0], mode="text",
                 text=["|0⟩", "|1⟩", "|+⟩", "|+i⟩"], hoverinfo="skip", name="labels"),
]
t0 = 4  # start at theta = 60 degrees
state_traces = []
for k, phi in enumerate(phis):
    x, y, z, txt = arrow(thetas[t0], phi)
    state_traces.append(go.Scatter3d(x=x, y=y, z=z, text=txt, mode="lines+markers+text",
                                     line=dict(color="crimson", width=7), marker=dict(size=[2, 6], color="crimson"),
                                     visible=(k == 0), name=f"state, phi={math.degrees(phi):.0f}°"))
fig = go.Figure(base + state_traces)
nb = len(base)
idx = list(range(nb, nb + len(phis)))

theta_steps = []
for theta in thetas:
    arrs = [arrow(theta, phi) for phi in phis]
    theta_steps.append(dict(method="restyle", label=f"{math.degrees(theta):.0f}°",
                            args=[{"x": [a[0] for a in arrs], "y": [a[1] for a in arrs],
                                   "z": [a[2] for a in arrs], "text": [a[3] for a in arrs]}, idx]))
phi_steps = [dict(method="restyle", label=f"{math.degrees(phi):.0f}°",
                  args=[{"visible": [j == k for j in range(len(phis))]}, idx]) for k, phi in enumerate(phis)]
fig.update_layout(
    height=640, showlegend=False, margin=dict(l=0, r=0, t=40, b=0),
    title="Pure qubit state on the Bloch sphere",
    scene=dict(aspectmode="cube", xaxis=dict(range=[-1.4, 1.4], title="x"),
               yaxis=dict(range=[-1.4, 1.4], title="y"), zaxis=dict(range=[-1.4, 1.4], title="z")),
    sliders=[dict(active=t0, currentvalue=dict(prefix="θ = "), pad=dict(t=10), y=0.14, steps=theta_steps),
             dict(active=0, currentvalue=dict(prefix="φ = "), pad=dict(t=10), y=0.0, steps=phi_steps)])
show(fig)3 · Measurement statistics and finite shots
The Born rule gives . A real experiment never sees directly. It sees outcomes and reports the frequency . Because is binomial, the standard error is .
Use the slider to change . The band is the exact standard-error band. The dots are simulated frequencies. They are seeded, so they are the same on every run.
grid = np.linspace(0, math.pi, 37)
p0 = np.array([s.qubit(t)["p0"] for t in grid])
shots = [10, 100, 1000, 10000]
g = np.random.default_rng(5)
freqs = {N: g.binomial(N, p0) / N for N in shots}
rms = {N: float(np.sqrt(np.mean((freqs[N] - p0) ** 2))) for N in shots}
for N in shots:
    print(f"N = {N:>5}: RMS error = {rms[N]:.4f},  RMS * sqrt(N) = {rms[N] * math.sqrt(N):.3f}")

ratio = rms[100] / rms[10000]
print(f"RMS(N=100) / RMS(N=10000) = {ratio:.2f}   (1/sqrt(N) scaling predicts 10)")
assert 5 < ratio < 20

# the scale-free combination RMS*sqrt(N) must match the exact value sqrt(mean p(1-p)) within sampling noise
exact = math.sqrt(np.mean(p0 * (1 - p0)))
print(f"exact sqrt(mean p0(1-p0)) = {exact:.3f}")
for N in shots[1:]:
    assert abs(rms[N] * math.sqrt(N) - exact) / exact < 0.35

deg = np.degrees(grid)
def band(N):
    se = np.sqrt(p0 * (1 - p0) / N)
    return np.clip(p0 + 2 * se, 0, 1), np.clip(p0 - 2 * se, 0, 1)

hi, lo = band(shots[0])
fig = go.Figure([
    go.Scatter(x=deg, y=hi, mode="lines", line=dict(width=0), showlegend=False, hoverinfo="skip"),
    go.Scatter(x=deg, y=lo, mode="lines", line=dict(width=0), fill="tonexty", fillcolor="rgba(76,120,168,0.25)",
               name="±2 standard errors", hoverinfo="skip"),
    go.Scatter(x=deg, y=p0, mode="lines", name="Born rule p₀ = cos²(θ/2)", line=dict(color="#4c78a8")),
    go.Scatter(x=deg, y=freqs[shots[0]], mode="markers", name="simulated frequency", marker=dict(color="crimson")),
])
steps = []
for N in shots:
    hi, lo = band(N)
    steps.append(dict(method="restyle", label=str(N), args=[{"y": [hi, lo, freqs[N]]}, [0, 1, 3]]))
fig.update_layout(height=480, title="Estimating p₀ from N shots", xaxis_title="θ (degrees)",
                  yaxis_title="probability of outcome 0", yaxis_range=[-0.05, 1.05],
                  sliders=[dict(active=0, currentvalue=dict(prefix="shots N = "), pad=dict(t=50), steps=steps)])
show(fig)
N = 10: RMS error = 0.1304, RMS * sqrt(N) = 0.412
N = 100: RMS error = 0.0415, RMS * sqrt(N) = 0.415
N = 1000: RMS error = 0.0100, RMS * sqrt(N) = 0.318
N = 10000: RMS error = 0.0032, RMS * sqrt(N) = 0.322
RMS(N=100) / RMS(N=10000) = 12.89 (1/sqrt(N) scaling predicts 10)
exact sqrt(mean p0(1-p0)) = 0.349
Explain. The typical error scales as . So 100 times more shots shrinks it by about a factor of 10. The code asserts two things. The measured ratio lies between 5 and 20. And matches the exact value within sampling noise. The band is narrowest at the poles, where . A state that is certain to give 0 never fluctuates.
4 · Mixed states live inside the ball
A mixed state is a probabilistic mixture of pure states, . Every single-qubit density matrix can be written
with eigenvalues and purity . The centre is the maximally mixed state .
g = np.random.default_rng(11)
def random_mixture(k):
    """Mixture of k random pure states (uniform on the sphere) with Dirichlet weights."""
    w = g.dirichlet(np.ones(k))
    rho = np.zeros((2, 2), complex)
    for wk in w:
        rho += wk * s.dm(s.ket(math.acos(1 - 2 * g.random()), 2 * math.pi * g.random()))
    return rho

states = [random_mixture(int(g.integers(1, 4))) for _ in range(400)]
R = np.array([s.bloch(r) for r in states])
radius = np.linalg.norm(R, axis=1)
pur = np.array([s.purity(r) for r in states])
for rho, r, P in zip(states, radius, pur):
    assert s.is_density_matrix(rho)
    assert r <= 1 + 1e-12                                   # inside or on the ball
    assert abs(P - (1 + r ** 2) / 2) < 1e-12                # purity formula
    ev = np.sort(np.linalg.eigvalsh(rho))
    assert np.allclose(ev, [(1 - r) / 2, (1 + r) / 2], atol=1e-12)

half = 0.5 * s.dm(s.KET0) + 0.5 * s.dm(s.KET1)
print("equal mixture of |0> and |1>: Bloch vector", s.bloch(half), " purity", s.purity(half))
assert np.allclose(s.bloch(half), 0) and abs(s.purity(half) - 0.5) < 1e-12
print(f"{len(states)} random mixtures checked; min radius {radius.min():.3f}, max radius {radius.max():.3f}")
equal mixture of |0> and |1>: Bloch vector [0. 0. 0.] purity 0.5
400 random mixtures checked; min radius 0.159, max radius 1.000
Explain. The equal mixture of and sits at the centre, . Its purity is , the minimum for a qubit. Mixing pulls the Bloch vector inside the sphere. Mixing is also linear: the mixture has Bloch vector , a point on the chord. A static view of these facts:
fig, ax = plt.subplots(1, 2, figsize=(10, 4))
rr = np.linspace(0, 1, 100)
ax[0].plot(rr, (1 + rr ** 2) / 2, color="#4c78a8", label=r"$(1+|r|^2)/2$")
ax[0].scatter(radius, pur, s=8, color="crimson", alpha=0.6, label="random mixtures")
ax[0].set_xlabel(r"Bloch radius $|\vec r|$"); ax[0].set_ylabel(r"purity Tr$\rho^2$"); ax[0].legend()
ax[0].set_title("Purity grows with distance from the centre")

t = np.linspace(0, 2 * np.pi, 200)
ax[1].plot(np.sin(t), np.cos(t), color="gray")
a, b = s.bloch(s.dm(s.ket(0.4, 0))), s.bloch(s.dm(s.ket(2.3, 0)))
lam = np.linspace(0, 1, 11)
chord = np.array([s.bloch(l * s.dm(s.ket(0.4, 0)) + (1 - l) * s.dm(s.ket(2.3, 0))) for l in lam])
assert np.allclose(chord, [l * a + (1 - l) * b for l in lam])   # mixing is linear in the Bloch vector
ax[1].plot(chord[:, 0], chord[:, 2], "o-", color="crimson", label="mixtures of two pure states")
ax[1].set_aspect("equal"); ax[1].set_xlabel("x"); ax[1].set_ylabel("z"); ax[1].legend(loc="lower left", fontsize=8)
ax[1].set_title("x–z cross-section of the Bloch ball")
plt.tight_layout(); plt.show()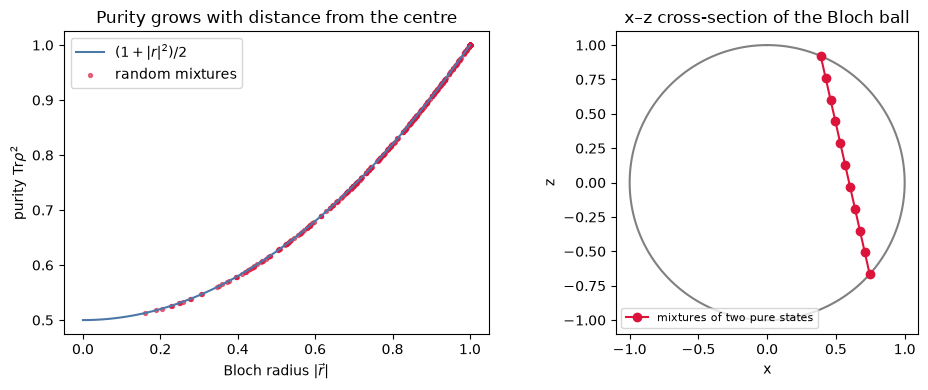
The 3D view below shows the same random mixtures, coloured by purity. Rotate it and hover over the points. No point leaves the unit ball.
fig = go.Figure([
    go.Surface(x=np.cos(u) * np.sin(v), y=np.sin(u) * np.sin(v), z=np.cos(v), opacity=0.08, showscale=False,
               colorscale=[[0, "gray"], [1, "gray"]], hoverinfo="skip"),
    go.Scatter3d(x=R[:, 0], y=R[:, 1], z=R[:, 2], mode="markers",
                 marker=dict(size=3, color=pur, colorscale="Viridis", cmin=0.5, cmax=1, colorbar=dict(title="purity")),
                 text=[f"|r| = {r:.3f}, purity = {p:.3f}" for r, p in zip(radius, pur)], hoverinfo="text"),
])
fig.update_layout(height=560, title="Random mixed states fill the Bloch ball", margin=dict(l=0, r=0, t=40, b=0),
                  scene=dict(aspectmode="cube"))
show(fig)Going deeper
Take a measurement along a unit vector (observable ). The Born rule in Bloch form is
So the outcome probability depends only on the projection of the Bloch vector on the measurement axis. Orthogonal states, such as and , sit at antipodal points on the sphere. They are not perpendicular. The next cell checks the formula for random states and random axes.
g = np.random.default_rng(3)
for _ in range(200):
    rho = random_mixture(2)
    n = g.normal(size=3); n /= np.linalg.norm(n)
    proj = 0.5 * (s.I2 + n[0] * s.X + n[1] * s.Y + n[2] * s.Z)
    assert abs(np.real(np.trace(rho @ proj)) - 0.5 * (1 + s.bloch(rho) @ n)) < 1e-12
# antipodal check: |0> and |1> are orthogonal and have opposite Bloch vectors
assert abs(np.vdot(s.KET0, s.KET1)) == 0 and np.allclose(s.bloch(s.dm(s.KET0)), -s.bloch(s.dm(s.KET1)))
print("Born rule in Bloch form verified for 200 random states and axes.")
Born rule in Bloch form verified for 200 random states and axes.
Exercises
Solution
gives , so (60°). Equivalently . The check cell below verifies it.
Solution
. Purity . Eigenvalues , that is 0.8 and 0.2. It is mixed, because .
Solution
The standard error is . Setting gives .
Check yourself
# Exercise 1
assert abs(s.qubit(math.pi / 3)["p0"] - 0.75) < 1e-12
assert abs(s.qubit(math.pi / 3)["z"] - 0.5) < 1e-12
# Exercise 2
rho = 0.5 * (s.I2 + 0.6 * s.X)
assert s.is_density_matrix(rho)
assert abs(s.purity(rho) - 0.68) < 1e-12
assert np.allclose(np.sort(np.linalg.eigvalsh(rho)), [0.2, 0.8])
# Exercise 3
N = 2500
assert abs(math.sqrt(0.25 / N) - 0.01) < 1e-15 and math.sqrt(0.25 / (N - 1)) > 0.01
print("All checks passed.")
All checks passed.
Limits of this model
This lab covers one qubit only. The Bloch ball is special to a single qubit. Two qubits need 15 real parameters, and the set of two-qubit states is not a ball.
We assumed ideal measurements: perfect projective measurements with no readout error. Real devices also mislabel outcomes.
The randomness is simulated. The shots come from a seeded pseudo-random generator. It mimics the statistics of quantum measurement, but it is not quantum randomness.
The picture ignores the global phase, which no measurement can detect. The relative phase is physical.
- Basics of quantum information. (n.d.). https://quantum.cloud.ibm.com/learning/en/courses/basics-of-quantum-information
- Preskill, J. (n.d.). Course Information for Physics 219/Computer Science 219 Quantum Computation (Formerly Physics 229). California Institute of Technology course page with lecture notes. https://www.preskill.caltech.edu/ph219/